The Setup That Cannot Be Ignored
Tesla, Inc. (TSLA) is the second most actively traded stock by dollar volume on U.S. exchanges as of May 30, 2026, trailing only NVIDIA. The stock trades near $312 per share, reflecting a market capitalization of approximately $1.0 trillion. Year-to-date performance stands at +61.4%, driven almost entirely by autonomous vehicle commercialization newsflow rather than core automotive earnings improvement. This divergence between narrative momentum and fundamental delivery creates one of the most tactically complex setups in the current market environment.
What the Financials Actually Show
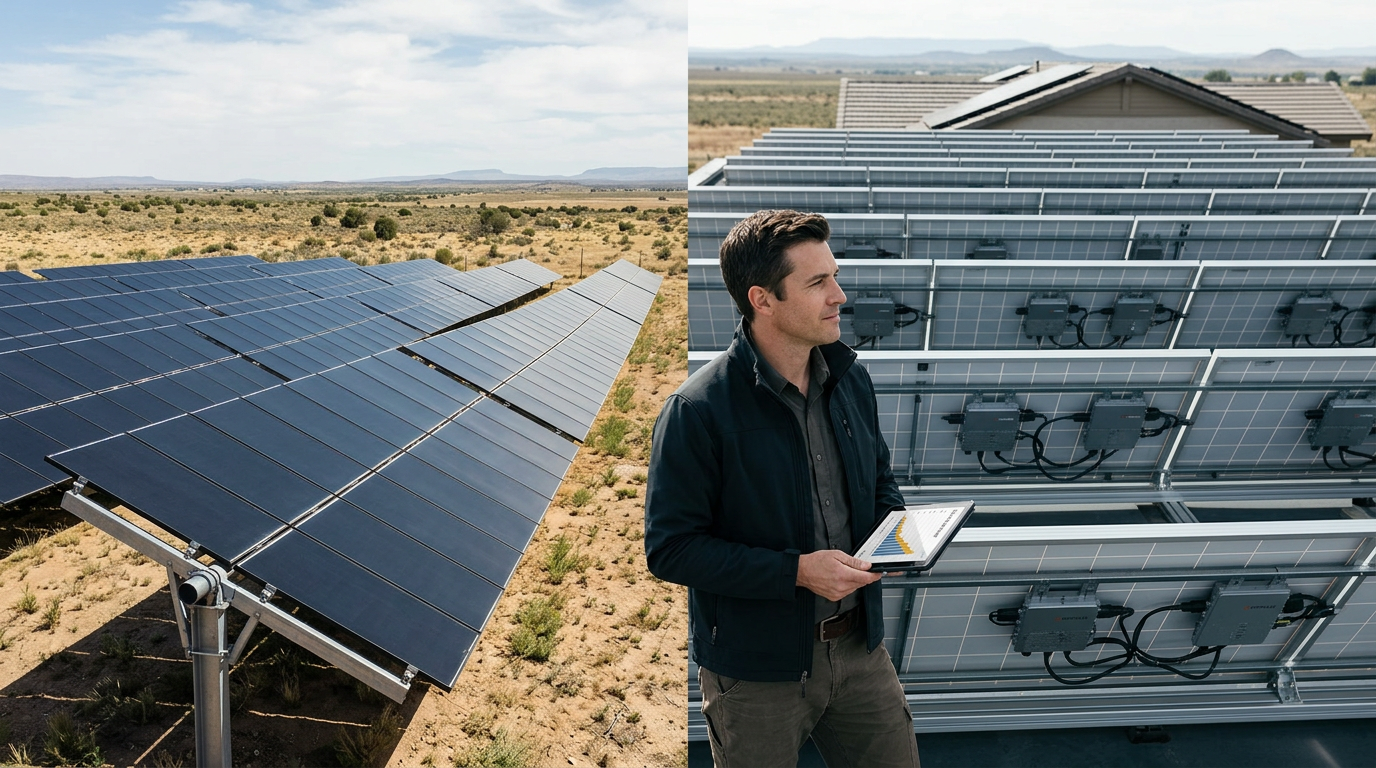
Tesla’s Q1 2026 report (delivered April 2026) revealed $21.3 billion in total revenue, down 4.2% year-over-year, as vehicle delivery volumes declined to 336,000 units from 386,810 in Q1 2025. Automotive gross margin, excluding regulatory credits, compressed to 14.6% – the lowest since Q3 2023. However, the Energy Generation and Storage segment produced $3.1 billion in revenue, up 67% annually, providing a critical earnings buffer. Non-GAAP EPS came in at $0.45, missing the $0.51 consensus by 11.8% – yet the stock rallied 9% post-earnings on robotaxi deployment language in the shareholder letter.
The Autonomous Vehicle Catalyst Window
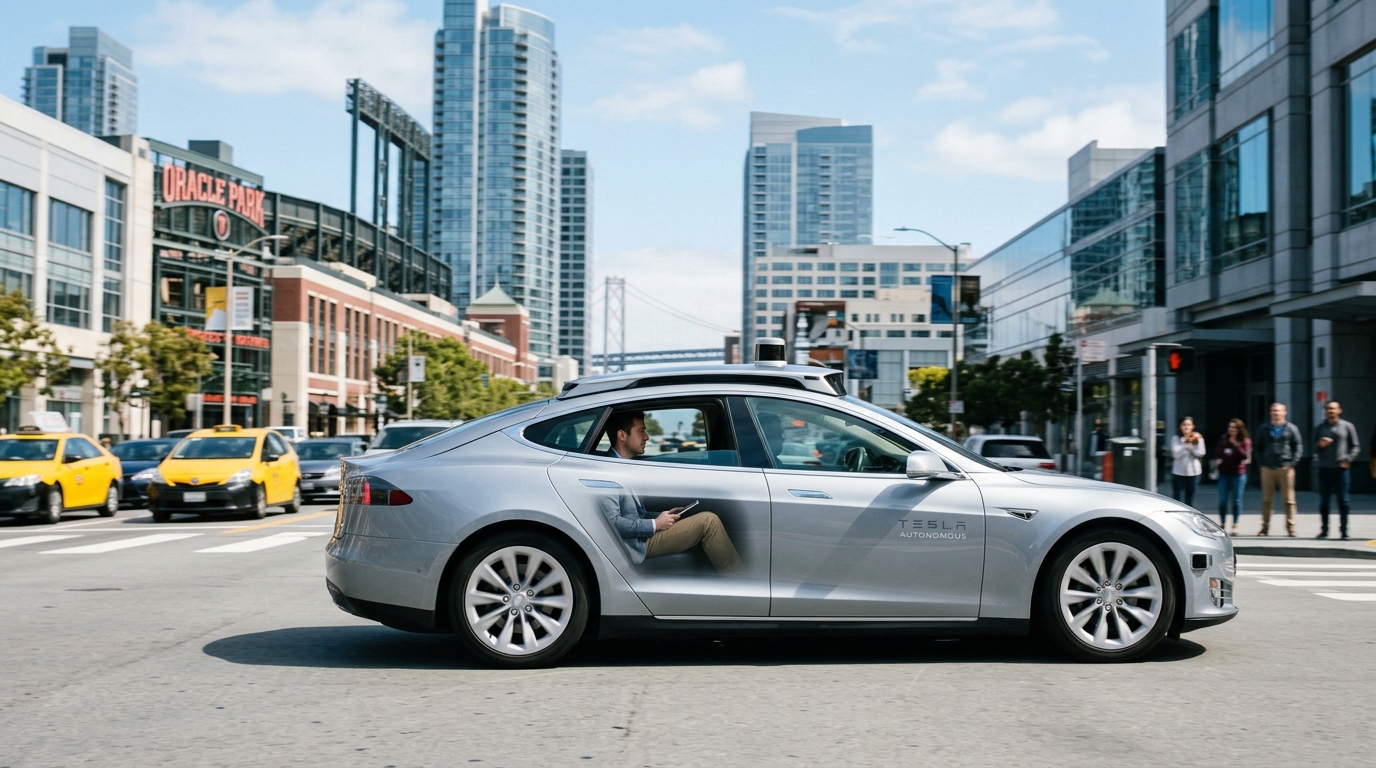
Tesla’s Cybercab robotaxi service launched in Austin, Texas in April 2026 with approximately 300 vehicles operating in geofenced zones. Management has guided for expansion to 10 additional U.S. markets by Q4 2026 and disclosed a unit economics model suggesting $0.30–$0.35 per mile in gross profit at scale. Analysts at Wedbush ($400 price target) and ARK Invest ($2,600 five-year target) argue the addressable market for autonomous ride-hailing exceeds $8 trillion globally by 2035. Skeptics at Gordon Haskett ($185 target) counter that regulatory timelines in California, New York, and the EU remain prohibitive through at least 2028.
Technical Structure and Decision Levels
TSLA is extended above all major moving averages: 21-day EMA at $289, 50-day SMA at $271, and 200-day SMA at $234. The stock has formed a ascending wedge pattern over the past 34 sessions, with declining volume on up days – a structure that historically resolves with either a breakout above $328 or a reversion toward the $275 to $285 support zone. MACD remains in positive territory but histogram bars are narrowing, flagging momentum deceleration without confirmed reversal.
Scenario Modeling
- Bull Case ($375–$420): Cybercab fleet expands to 2,500+ vehicles by Q3 2026, California grants full commercial AV operating permits, and Q2 2026 automotive margins recover above 16% on refreshed Model Y volume. Institutional rotation into the autonomous mobility theme accelerates.
- Base Case ($270–$330): Robotaxi expansion proceeds on schedule but at modest scale, core automotive margins stabilize without meaningful recovery, and the stock trades range-bound as traders wait for Q3 2026 delivery data and full-year guidance revision.
- Bear Case ($195–$230): A safety incident involving Cybercab triggers regulatory suspension in one or more markets, Q2 2026 deliveries miss 350,000 unit expectations, and broader risk-off sentiment pressures high-multiple growth equities. The ascending wedge resolves to the downside with a measured move target near $240.
For informational and educational purposes only. Not investment advice. Trading involves risk, including loss of principal.